Click to Access Data Cube
Click to Access WebGIS
Click to access Web App
About PONTOS Platform
The PONTOS Platform offers easy-to-use, easy-to-access and free-of-charge online services for various specialists, including those who do not have the technical expertise to write codes or algorithms to process data.
The PONTOS project makes information about the Black Sea environment from the EU Copernicus Earth Observation platform accessible to scientists, policymakers, citizens, and other relevant stakeholders through an operational platform, called PONTOS platform. The Platform combines various applications and tools for the users.
The PONTOS platform retrieves and manages satellite, airborne, and field data, automatically finds and utilises existing maps from Copernicus and other repositories, and allows data uploads from end users.
The Platform offers the following services:
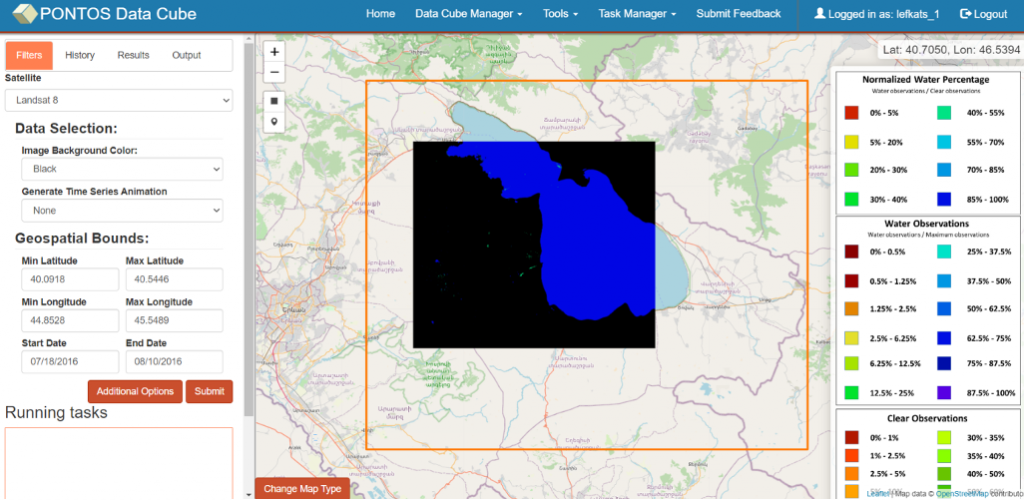
- PONTOS Data Cube: easy production of maps from satellite data
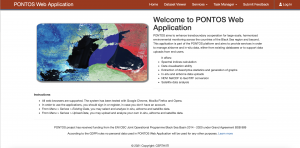
- PONTOS Web Application: airborne and in-situ data management support
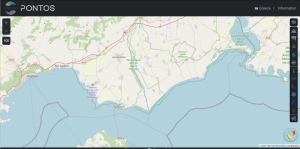
- PONTOS WebGIS: a combination of already available information already existing on maps
An essential ingredient for enhancing the use of Copernicus products and services for the environmental monitoring of the Black Sea is to enable and enhance participation, knowledge, and skills of most possible local and regional actors, from scientists to government employees and citizens.
Regarding the defined areas that are incorporated and custom analyses to be performed in PONTOS Platform, those correspond to PONTOS’ pilot sites:
- PONTOS - AM (Armenia): Sevan Lake and Sevan Lake Basin
- PONTOS - GE (Georgia): Rioni River Delta and Kolkheti National Park
- PONTOS - GR (Greece): Nestos River and Nestos River Delta
- PONTOS - UA (Ukraine): Coastline from Odessa city to the Danube river delta as well as Dniester river delta area and adjacent estuary.
Constant improvement and quality validation of the tools is an important part of PONTOS project. To achieve this, a feedback form is provided in the PONTOS Web Application and PONTOS Data Cube to enable users in providing continuous feedback about the quality of the application. Users are able to write their own message about their experience or suggest improvements. All user input is saved in the database with respect to GDPR legislation and super users can review them at any time.
Link to the questionnaire: https://docs.google.com/forms/
Data Cube link: http://160.40.53.201:
Web Application link: http://160.40.53.201:
WebGIS link: https://labecolftp.env.duth.gr/PONTOS
Platform Solutions: PONTOS Open Data Cube
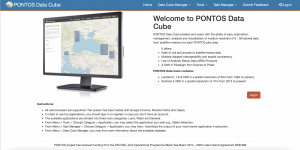
PONTOS Open Data Cube (ODC) empowers the end-users with the ability to easily explore, manage, analyze and visualize Analysis Ready Data (ARD) from satellite missions for each pilot area. PONTOS Data Cube contains Landsat 5, 7 and 8 ARD in a spatial resolution of 30m from 1984 to present and Sentinel-2 ARD in a spatial resolution of 10 m from 2015 to present.
Benefits of using ODC
- Decreased time and specialized knowledge to access, explore and process satellite data.
- Efficient time series analysis of EO satellite data.
- Consistent data architectures that allow tools and algorithms sharing.
- Open source software solutions that are promoted through community contributions.
- Constant user support.
- Free and open EO satellite data and application algorithms.
The available tools for PONTOS Data Cube
- Land (Urbanization, Spectral Anomaly, Fractional Cover, Spectral Indices)
- Water (Water Detection, Water Quality Total Suspended Matter (TSM), Coastal Change)
- General (Custom Mosaic, Cloud Coverage)
Platform Solutions: PONTOS WEB APPLICATION
PONTOS Web Application is integrated into the PONTOS platform. It manages and analyzes the airborne and in-situ data created within the project. The Web Application is complementary to PONTOS Data Cube and PONTOS WebGIS. The Web Application Services are available in English, Armenian, Greek, Georgian, and Ukrainian languages.
Web application tools
Existing Airborne Data Management
- Spectral indices calculation
- Data visualisation ability
- Output downloading in .png or GeoTIFF format
Data Uploads from End-Users
- Supports in-situ and airborne data uploads
- Extraction of descriptive statistics regarding the database
- Export outputs; Airborne data visualization
- Spectral indices calculation
Existing In-situ Data Management
- Generation of graphs
- Extraction of descriptive statistics regarding the dataset
- Output downloading in .csv format
-

- Description: PONTOS Web Application airborne image visualization (on the example of the selected site within the Dniester estuary in the Ukrainian pilot area)
-
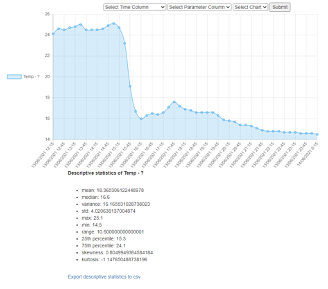
- Description: PONTOS Web Application in-situ data analysis (on the example of the Ukraine’s pilot area)
-
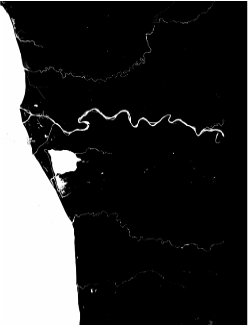
- Description: PONTOS Web Application HydroPeriod visualization (on the example of the Georgia’s pilot area)
Platform Solutions: PONTOS WebGIS
The aim of creating Web Geographic Information System (GIS) is to further enhance the user experience in terms of user accessibility, data aggregation and data visualisation. The WebGIS aids decision making, provides reliable datasets to scientists and engineers, engages active citizens and the broader public into coastal zone issues, promotes the distribution of information among coastal managers, stakeholders and the general public.
PONTOS WebGIS service interactively visualises the spatial data collected in the PONTOS project and organised in a common spatial infrastructure. The system combines the principles and tools of Geographic Information Systems (GIS) and aims to harmonise the large and multi-dimensional datasets collected within the Project. WebGIS supports the visualisation of chlorophyll concentration, land uses, salinity and temperature, hydrology, weather, and topography data.
Users of PONTOS webGIS service can easily access, select data layers and visualize data on the four pilot areas obtained:
- from external data sources, like the Copernicus Hub for Sentinel satellite imagery, the Earth Explorer for other satellite data, the CMEMS and EMODnet repositories
- the external data from national/regional databases
- the data produced by the PONTOS Consortium within the frame of the project, to assess coastal erosion, water balance and uses, eutrophication, floating vegetation and forest changes
- the geospatial data uploaded by end-users and stakeholders at the selected pilots.

Description: Basemap modes available in PONTOS webGIS: Transport, Transport Dark, Watercolor, Satellite, and Terrain (on the example of the Greek pilot area
DATA VISUALIZATION MODULE
The objective of this document is to provide a report about the interface of the PONTOS platform towards the user, including an overview of the platform functionalities. The document outlines the technologies, and integration points of the services that make up the framework for visualizing and monitoring the PONTOS platform. The present deliverable serves as a companion text to the software platform that has been produced and is already released.
This document is structured into 3 major chapters according to the components of the platform:
- Chapter 2 presents the PONTOS Data Cube.
- Chapter 3 presents the PONTOS Web Application.
- Chapter 4 presents the PONTOS WebGIS.
Please click on the link to download the document: Data Visualization Module.
